What AED 1 Million Really Buys in Dubai: A 1-Bedroom Cost Walkthrough for JLT, Al Furjan and DSO
By Gardener
On a budget of about AED 1 million, JLT, Al Furjan and Dubai Silicon Oasis (DSO) often end up on the same shortlist. Instead of describing them, this piece runs the same sums on all three. It is an exercise, not a forecast. Every step shows its formula, so you can swap in the numbers for a building you are actually considering.
The short version: after costs, AED 1 million buys a home of about AED 938,000. In this exercise, the three areas end up about 1.2 percentage points apart, and realistic changes to service charges or rent can close much of that gap. The building matters more than the area name.
Step 1: Start from public indicators
| Area | 1-bed price | Annual rent | Headline yield | Source |
|---|---|---|---|---|
| JLT | About AED 1.58M (USD 428,900) | About AED 94,000 (USD 2,130/month) | 5.96% | Global Property Guide, Q2 2026 |
| Al Furjan | About AED 1.15M (USD 314,500) | About AED 81,000 (USD 1,830/month) | 6.98% | Global Property Guide, Q2 2026 |
| DSO | AED 856,000 | AED 63,400 | 7.90% (estimate for the whole affordable apartment category) | Bayut Q3 2026, via Gulf Today |
USD figures convert at AED 3.6725. The exact conversion for the Al Furjan price is AED 1,155,001, rounded here to 1.15 million. All three indicators rest on asking prices and asking rents rather than deals, and the sources differ. So read the gaps below as “what these indicators imply,” not “this area is better.”
Step 2: Add the cost of buying
For a cash purchase of a ready home, using Dubai Land Department (DLD) fee pages and Property Finder’s guide (updated July 2026):
- DLD transfer fee: 4% of the price. It is officially split 2% and 2%, but buyers commonly pay all of it, so check your contract.
- Trustee or service partner fee: AED 4,000 plus 5% VAT at AED 500,000 and above, so AED 4,200.
- Title deed items: AED 250 certificate, AED 250 apartment item, and AED 10 each for knowledge and innovation fees, so AED 520 on the DLD page. Property Finder quotes AED 580 for the deed, so confirm the amount at the time of sale.
- Agency commission: typically 2% plus 5% VAT, so 2.1%.
| Area | Purchase price (AED) | Buying costs (AED) | Total needed (AED) | Against AED 1M |
|---|---|---|---|---|
| JLT average | 1,580,000 | 101,100 | 1,681,100 | About 681,100 short |
| Al Furjan average | 1,150,000 | 74,870 | 1,224,870 | About 224,870 short |
| DSO average | 856,000 | About 56,900 | About 912,900 | About 87,100 left |
Work it backward: (1,000,000 − 4,720) ÷ 1.061 = about 938,000. So with costs included, AED 1 million caps your price at about AED 938,000. At area averages, only DSO fits.
A mortgage adds more: registration at 0.25% of the loan, a AED 250 deed fee, small fixed fees, a AED 4,000 plus VAT service partner fee, and a typical AED 2,500–3,500 valuation.
Step 3: Re-run it for a home of about AED 940,000
Averages rule out JLT and Al Furjan at once, but buildings vary a lot. Bayut’s page for JLT’s Icon Tower 2 shows an average 1-bedroom asking price near AED 1.14 million and a DLD-based average transaction near AED 793,000. A Property Finder listing in Al Furjan’s Al Fouad Building asks AED 1.1 million, with February 2026 building sales shown at AED 650,000 (801 sq ft) and AED 849,000 (898 sq ft). Size, floor and timing differ, so this is not a discount you can count on. It does show that “the area average is out of reach” and “nothing exists at that price” are different claims.
For a like-for-like run, I round the cap up to AED 940,000. With costs, that comes to AED 1,002,060, slightly over budget, and I use that figure for all the returns below. Each area’s rent-to-price ratio is then applied to AED 940,000. This is a simplification: nothing guarantees that a cheaper building earns the same ratio.
| Area | Average rent ÷ average price | Assumed rent on AED 940,000 |
|---|---|---|
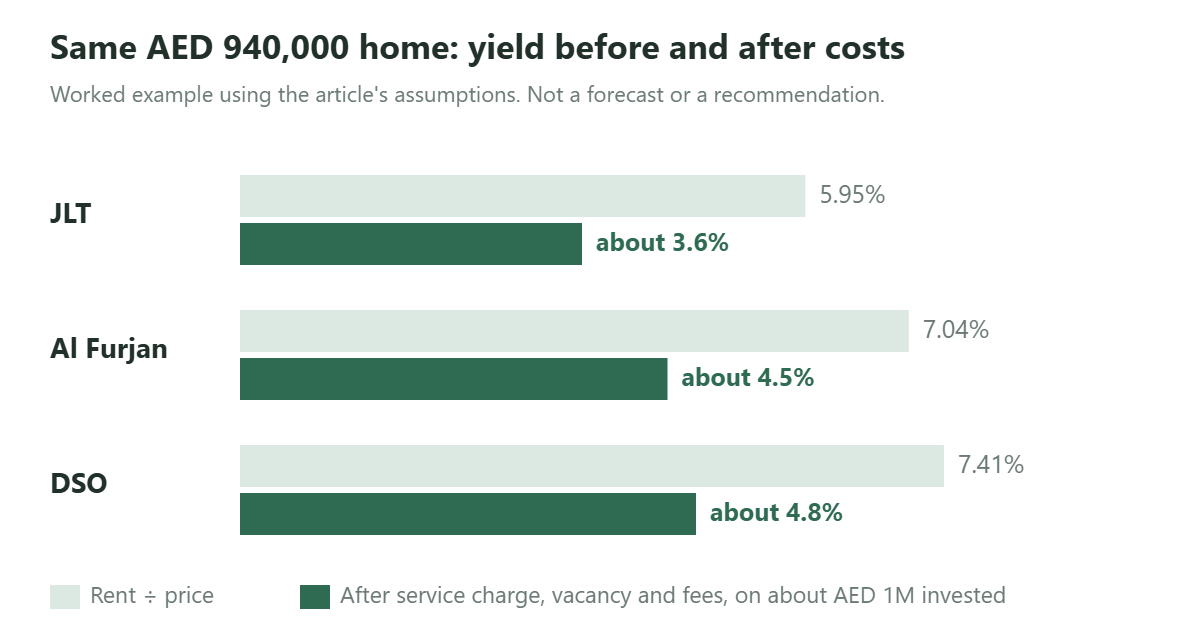
| JLT | 94,000 ÷ 1,580,000 = 5.95% | About AED 55,900 |
| Al Furjan | 81,000 ÷ 1,150,000 = 7.04% | About AED 66,200 |
| DSO | 63,400 ÷ 856,000 = 7.41% | About AED 69,600 |
Al Furjan’s 7.04% differs slightly from the source’s 6.98% because of rounding. DSO’s 7.41% sits below Bayut’s 7.90% because that figure is a category estimate, not a 1-bedroom one. Always check which category a quoted yield belongs to.
Step 4: Subtract running costs
Global Property Guide says its yields are gross and that net yields are “typically around 1.5% to 2% lower.” To work it out yourself, use these assumptions:
- 800 sq ft unit
- Service charge of AED 15 per sq ft in all three areas, so AED 12,000 a year
- One month of vacancy: rent ÷ 12
- Letting and management fee: 5% of rent
- Money invested: AED 1,002,060
| Area | Rent | Service charge | Vacancy | Fee | Net income (AED) | Return on money in |
|---|---|---|---|---|---|---|
| JLT | 55,900 | −12,000 | −4,658 | −2,795 | 36,447 | 3.6% |
| Al Furjan | 66,200 | −12,000 | −5,517 | −3,310 | 45,373 | 4.5% |
| DSO | 69,600 | −12,000 | −5,800 | −3,480 | 48,320 | 4.8% |
A ratio of about 6–7% has become about 3.6–4.8%. Loan interest, repairs and any home-country tax are still not included.
Step 5: Change only the service charge
The gaps above came from the rent assumption, but service charges differ in real life too. AiGents Realty gives AED 7–12 per sq ft for DSO, saying its rates draw on RERA-approved budgets and consultancy data. That is a vendor figure, not a building figure, and the article gives nothing for JLT or Al Furjan. So here is a sensitivity test for DSO only.
| Service charge per sq ft (800 sq ft) | Annual charge (AED) | DSO net income (AED) | Return on money in |
|---|---|---|---|
| AED 10 | 8,000 | 52,320 | 5.2% |
| AED 15 | 12,000 | 48,320 | 4.8% |
| AED 20 | 16,000 | 44,320 | 4.4% |
Each AED 5 moves the return by about 0.4 points, comparable to much of the spread between areas. So find the building’s approved charge before you compare areas. The same vendor says budgets are approved through DLD’s Mollak system, and advises asking the seller for payment history and the owners association for financial statements. Confirm how to look this up with DLD or the Dubai REST app.
Step 6: Change only the rent
Indicators are usually asking rents, so real contracts can come in lower. Here is DSO again, keeping the AED 12,000 service charge, one month of vacancy and 5% fee.
| Annual rent (AED) | Net income (AED) | Return on money in |
|---|---|---|
| 69,600 (assumed) | 48,320 | 4.8% |
| 62,640 (10% lower) | 42,288 | 4.2% |
| 55,680 (20% lower) | 36,256 | 3.6% |
The market is an input too. As reported by The Arabian Post, ValuStrat’s Q3 data shows average resale prices at AED 1,627 per sq ft, down 4.4% on the quarter and 1.5% on the year. Resale deals rose 18.5% on the quarter, and off-plan registrations fell to 24,375, a fourth straight quarterly decline. Homes under AED 1 million made up about a third of resale deals. ValuStrat also said overall home values had adjusted by about 10% since regional conflicts began. Bayut, meanwhile, said asking prices in many popular areas stayed broadly steady in the same quarter, so watching asking prices alone could miss a correction.
Run it on your own unit
Do not read the order of these tables as a ranking. Replace these five inputs and the sums still work:
- Recent actual sale prices for the same building and layout
- Actual signed rents
- The building’s approved service charge, and any arrears
- Your vacancy and management fee assumptions
- Selling costs, exchange rates and tax duties in your home country
For the wider map, see the guide to Dubai’s nine zones. For transport, see the Blue Line, Etihad Rail and new airport analysis.
Sources
- Global Property Guide, UAE gross rental yields
- Gulf Today (press), Bayut Q3 2026 report, Oct 28, 2026
- The Arabian Post (press), ValuStrat Q3 data
- ValuStrat (vendor), June 2026 market data
- Property Finder (vendor), DLD fees, updated Jul 3, 2026
- AiGents Realty (vendor), service charges by area, updated Sep 2026
- Dubai Land Department, Property Sale Registration
- Dubai Land Department, Mortgage Registration
- Bayut (vendor), JLT Icon Tower 2, 1-bedrooms
- Property Finder (vendor), Al Furjan listing and transaction history
Photo: Dubai Marina, Francisco Anzola, CC BY 2.0. Resized. Photo: JLT at Night, Molochmeditates, CC BY-SA 4.0. Resized. Charts and maps by Tim and Lily.