Blue Line, Etihad Rail, New Airport: What Dubai’s Transport Projects Do and Don’t Mean for Property
By Gardener
A new rail line is a fact about travel time. It is not a guarantee about house prices. Dubai currently offers a clean test of the difference. Etihad Rail’s Dubai station opened on September 30, 2026; the Metro Blue Line is targeted for September 9, 2029; and phase one of Al Maktoum International Airport is targeted for 2032. Yet Q3 2026 average resale prices were 1.5% lower than a year earlier, and even areas pitched as winners have seen prices or rents fall.
This piece answers five questions a buyer should ask. For neighborhood detail, see the guide to Dubai’s nine zones. For purchase costs line by line, see the JLT, Al Furjan and DSO walkthrough.
Question 1: What is actually happening, and when?
| When | What | Status |
|---|---|---|
| June 2025 | Blue Line construction starts (not re-verified) | Done |
| May 2026 | Blue Line tunneling begins; government reports 20% progress | Done |
| July 2026 | RTA announces first tunneling phase complete | Done |
| September 2026 | 26% progress reported by one rail trade outlet | Single report |
| September 30, 2026 | Etihad Rail passenger service starts at Dubai’s Al Yalayis station | Running |
| End of 2026 | Blue Line 30% progress target | Planned |
| 2027 | New airport’s second runway due to open; flydubai may move some aircraft | Planned |
| September 9, 2029 | Blue Line opening target (30 km, 14 stations) | Planned |
| 2030 | Dubai to Abu Dhabi high-speed rail, about 30 minutes | Press report |
| 2032 | Al Maktoum International phase one target (150 million passengers a year) | Planned |
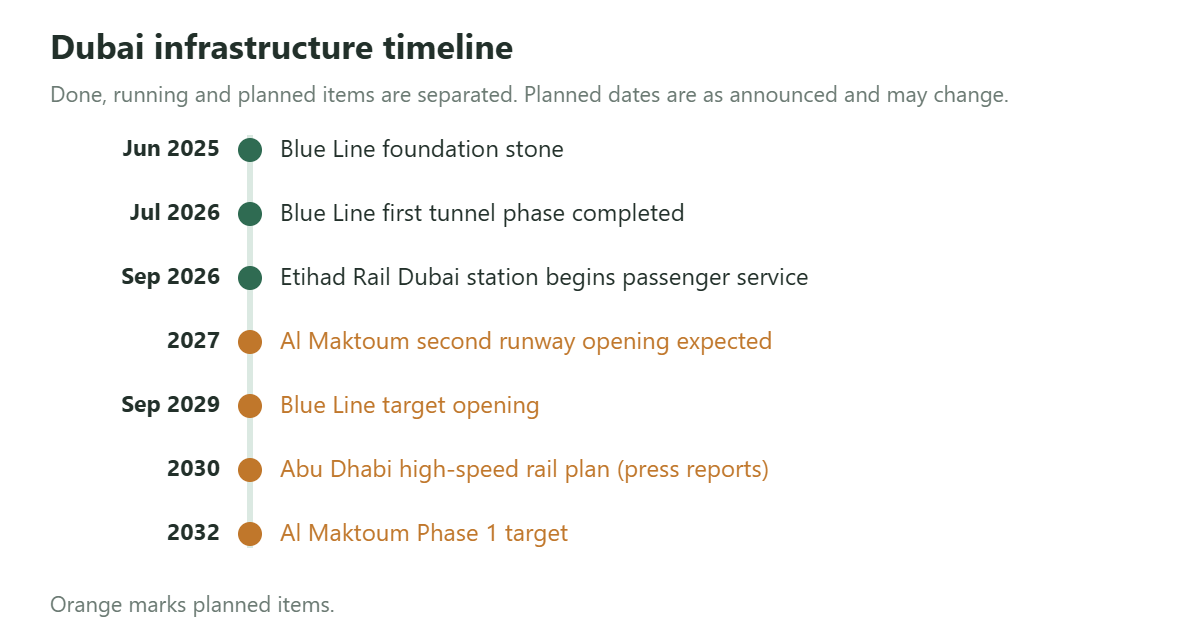
The further out a project is, the larger the uncertainty about both its date and its effect.
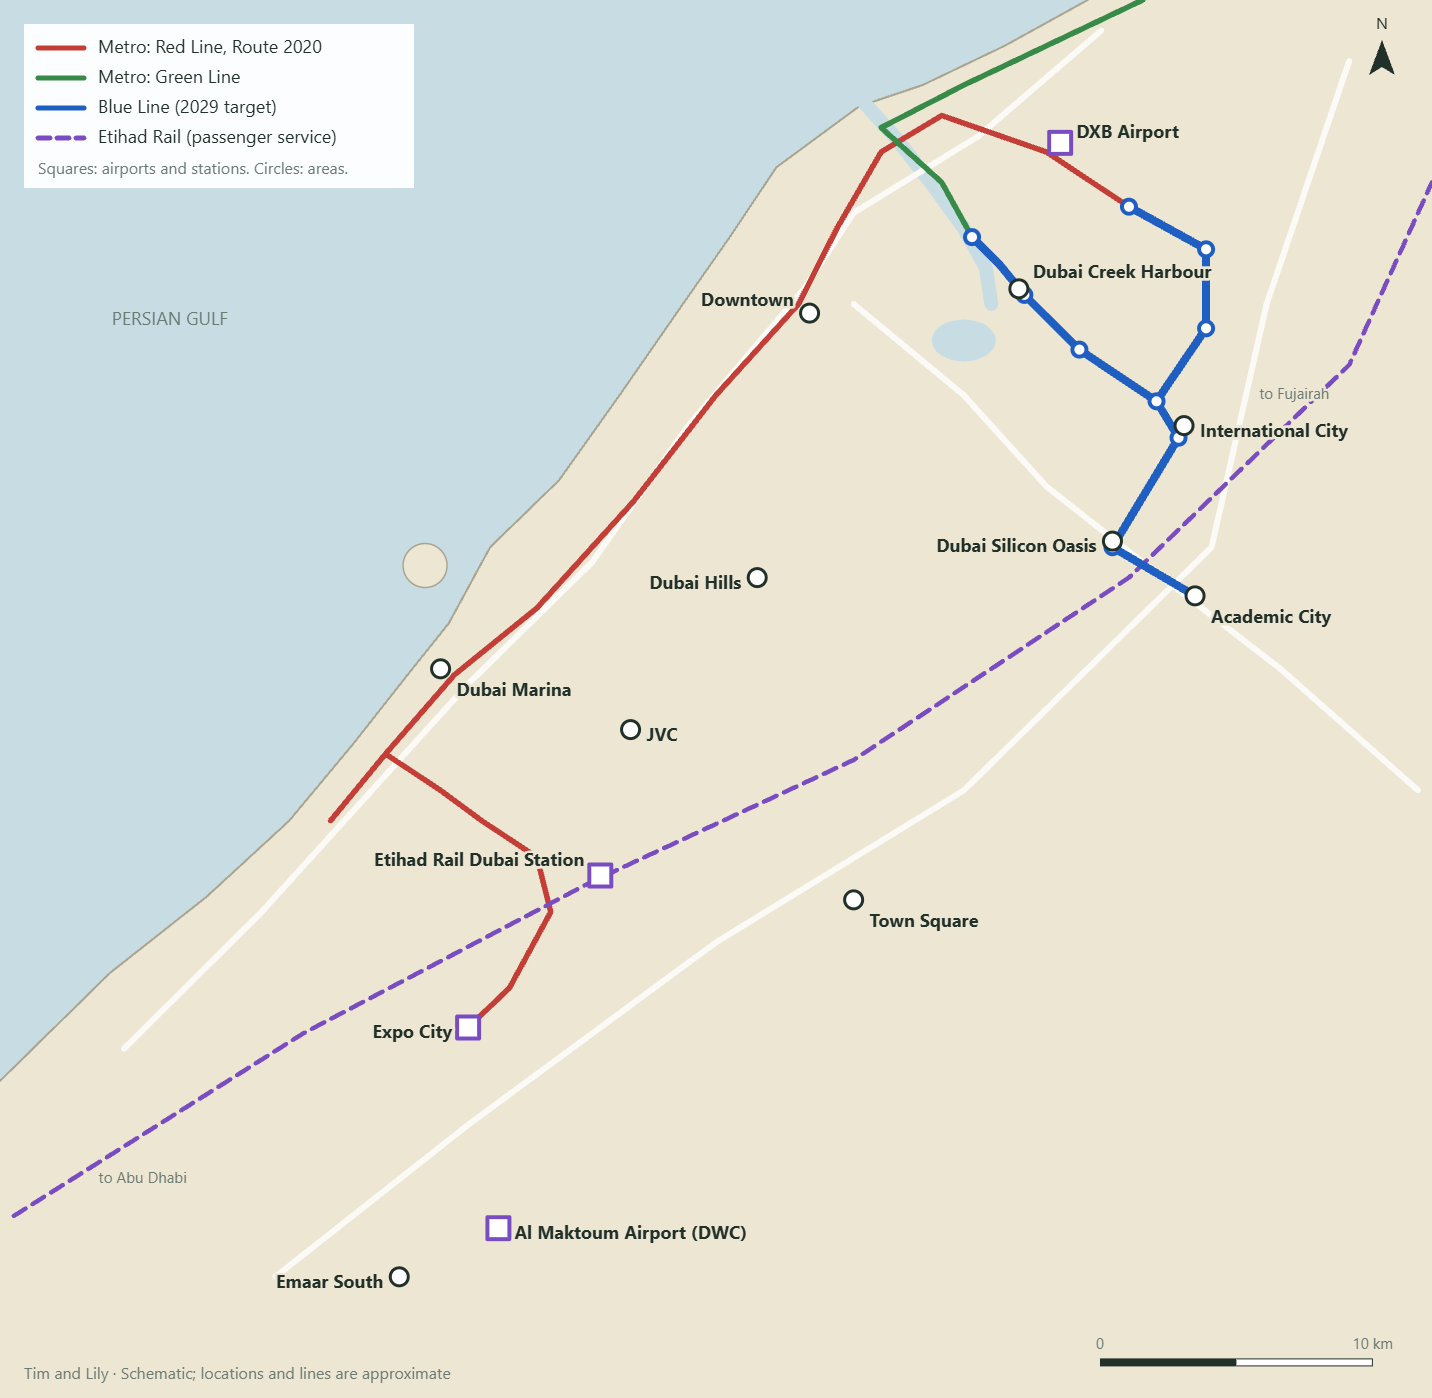
- Blue Line: 30 km, 15.5 km of it underground, at over AED 20.5 billion. A 21 km route runs from Creek through Festival City, Creek Harbour, Ras Al Khor, International City and DSO to Academic City. A 9 km route runs from Centrepoint through Mirdif and Al Warqa’a to International City 1.
- Etihad Rail: the Dubai station is beside Jumeirah Golf Estates, linked to the Red Line by a walkway of about 400 m. Abu Dhabi is about an hour away. Opening day had five round trips, with Comfort fares from AED 39 and Premium at AED 109. A Fujairah service also runs.
- Al Maktoum International: a reported USD 35 billion project. Phase one handles 150 million passengers a year, and the full plan is more than 260 million with five runways.
The Dubai government said in June 2026 that the second runway had been completed, while Dubai Airports’ CEO puts its opening in 2027. Finished and operating are different things. I found no date for an Emirates move. Paul Griffiths has said Emirates and flydubai will need the new airport’s capacity as DXB fills up, in a phased transfer.
Question 2: Who gains what, and what is the catch?
Figures are vendor aggregates or portal data, not individual deals. “Simple” means average 1-bedroom rent divided by average resale price.
| Area | Transport change | Possible upside | Catch | Figures I checked |
|---|---|---|---|---|
| Creek Harbour | Blue Line station | Better airport and center access | 1-bed rent down 5.1% in Q3; more supply on site | AED 2,300/sq ft; simple 5.4% |
| International City | Several Blue Line stations | First metro access | Uneven management; expectations may be priced in | AED 700–850/sq ft (vendor); asking rent AED 60,000 |
| DSO | Blue Line station | Easier inland commutes | Vendors say mainly leasehold; asking index falling | Asking 1-bed AED 856,000; rent AED 63,400; simple 7.4% |
| Town Square | No metro; measure the drive to Etihad Rail yourself | Family demand | Road dependence, on-site supply | H1 1-bed AED 868,186; rent AED 59,555; simple 6.9% |
| JVC | Little direct change; about 17-minute drive to Etihad Rail | Broad tenant demand | About 18,500 units due, mostly small | AED 1,225/sq ft (down 5.9% on the year); simple 7.1% |
| Dubai Hills | Little change; about 18-minute drive to Etihad Rail | Established family demand | High prices; 1-bed rent down 4.4% | AED 2,247/sq ft; simple 5.5% |
| Emaar South | New airport catchment | Long-term jobs and airport demand | Payoff in the 2030s; Dubai South supply | Median AED 1,750/sq ft on recorded sales; vendor yield 7% |
| Downtown | Little direct change | Proven central demand | 1-bed rent down 10.2%; 1-bed resale deals down 47% | AED 2,730/sq ft; simple 4.8% |
| Marina | Little direct change | Existing Red Line and coastal demand | Building age; price per sq ft down 4.2% | AED 1,857/sq ft; simple 5.9% |
The pattern: new stations bring the biggest travel-time change but may be running ahead of themselves. Areas that already have transport and demand gain less from a new project. Areas heavy in small units can feel rent pressure regardless of transport.
Question 3: How much weight can the “up to 25%” claim bear?
RTA Director General Mattar Al Tayer said the Blue Line should lift land and property values “by up to 25 per cent around Metro stations.” Before you lean on that figure:
- It is a ceiling. “Up to” is not an average or an expected value.
- No baseline or period is given. Compared with what price, and when? Net of market moves or not?
- The radius and unit type are not specified. A walkable 1-bedroom and a villa a drive away would not behave alike.
- It comes from the project’s sponsor. Khaleej Times also quotes a JLL consultant expecting more buying and appreciation, but that too is a forward-looking opinion. I found no independent after-the-fact check.
- Ridership and capacity are different numbers. For the Creek Harbour station, official figures give expected daily ridership above 70,000 by 2040 and capacity of about 160,000. Do not quote the larger one as demand.
A link between metro access and rent is not baseless. Property Finder estimates that moving more than 1 km from major stations can cut 1-bedroom rents by about 5–15%, depending on the area and building quality. It is a vendor estimate, and location and building differences are mixed into it.
Question 4: Is the good news already in the price?
Projects are public long before they open. On Betterhomes’ figures, DSO’s average sale price went from AED 843 per sq ft in 2024 to AED 1,339 in 2025. A vendor article citing Bayut’s index then reports DSO apartments down 12.64% on the year as of June 2026. The sources differ, so these cannot be joined into one trend, and neither move can be pinned on the Blue Line. They are still a reason to doubt that “construction started” means “prices will rise from here.”
Three comparisons help:
- Prices near a planned station against a similar community with no transport change
- Actual deals against asking prices in the same building
- Rents before and after the news, since rents sit closer to real occupier demand
Then look at supply and the wider market. Cushman & Wakefield Core said in February 2026 that nearly 45% of under-construction stock sat in JVC/JVT, Dubai South, MBR City, Business Bay and Dubailand Residence Complex, and that about 66% of upcoming supply was studios and 1-bedrooms. More than 400,000 units are under construction or announced for 2026–30, though it expects far fewer to be delivered. One vendor count gives about 18,500 units for JVC/JVT and about 14,200 for the Dubai South and Expo corridor in 2026–27.
The market is correcting too. In ValuStrat’s Q3 data, as reported, resale deals rose 18.5% on the quarter but were 23.8% lower on the year, and off-plan registrations fell to 24,375, a fourth straight decline. ValuStrat said home values had adjusted by about 10% since regional conflicts began. Rather than forecasting those events, stress-test longer vacancies and selling periods.
Question 5: What is left after costs?
The numbers in ads and articles are usually gross. Global Property Guide says net yields are “typically around 1.5% to 2% lower.” Here is a worked example using JVC averages. It is not a forecast for the area.
| Item | Amount or assumption |
|---|---|
| Average resale price | AED 946,922 |
| Purchase cost including 6.5% buying costs | About AED 1,008,472 |
| Average annual rent | AED 67,437 |
| Gross yield (rent ÷ price) | About 7.1% |
| Service charge (750 sq ft × AED 12, assumed) | −AED 9,000 |
| One month of vacancy (assumed) | −AED 5,620 |
| 5% management fee (assumed) | −AED 3,372 |
| Income left | AED 49,445 |
| Net yield (income ÷ purchase cost) | About 4.9% |
Loan interest, repairs, selling costs and home-country tax are not included, and nothing guarantees that the average rent and the average price describe the same homes. Service charges matter as well: vendor figures per sq ft are AED 20–30 for Downtown, 18–22 for Marina, 10–13 for JVC and 8–10 for International City. Use the amount on the building’s actual invoice.
Claims vs what the evidence supports
| You may hear | A fairer reading |
|---|---|
| “It opens in 2029, so prices rise until 2029.” | Markets can price news early, and interest rates or supply can move first. |
| “25% is there for the taking.” | It is the upper end of the project sponsor’s estimate. |
| “Demand moves the day the airport opens.” | The airport CEO describes a transfer in stages. |
| “Everything near an Etihad Rail station is station-side.” | If you must drive to the station, daily life changes less. |
| “A high gross yield covers vacancy risk.” | One empty month alone takes about 8% of a year’s rent. |
Before you decide
- Real walking or driving time from home to the station
- Construction noise and access near the building
- Recent sale prices and signed rents in the same building
- Units due nearby, and their sizes
- Net yield after service charge, vacancy and fees
- Freehold or leasehold, and what the title deed says
- Whether your finances survive a one- or two-year delay
- A plan if regional uncertainty stretches out a sale
- Tax filing duties in your home country
The first numbers to find are recent sale prices and signed rents in the same building. Use the Dubai REST app or similar registry-based tools, then look at area averages.
Sources
Official
Press
- Dubai Eye, RTA progress target and 25% estimate
- Khaleej Times, metro and property values
- Gulf News, Blue Line routes explained
- The National, first tunneling phase
- RaillyNews, 26% progress
- The National, Etihad Rail fares and service
- Khaleej Times, Al Yalayis station and drive times
- Gulf News, Al Yalayis station guide
- GDN, new airport 2032 schedule
- Khaleej Times, new airport schedule and scale
- Khaleej Times, flydubai and second runway
- Gulf News, second runway in 2027
- The Arabian Post, ValuStrat Q3 data
- Khaleej Times, supply in five communities
- Gulf Today, Bayut Q3 2026 report
Industry and vendor
- ValuStrat, June 2026 market data
- Metropolitan reports: Creek Harbour, Town Square H1, JVC, Dubai Hills, Downtown, Marina
- DXBinteract, Emaar South
- Real Estate Club Dubai: DSO, price per sq ft, 2026–27 supply
- Betterhomes: Silicon Oasis, Town Square
- Property Finder, metro and rents
- AiGents Realty, yields and service charges
- Global Property Guide, UAE yields
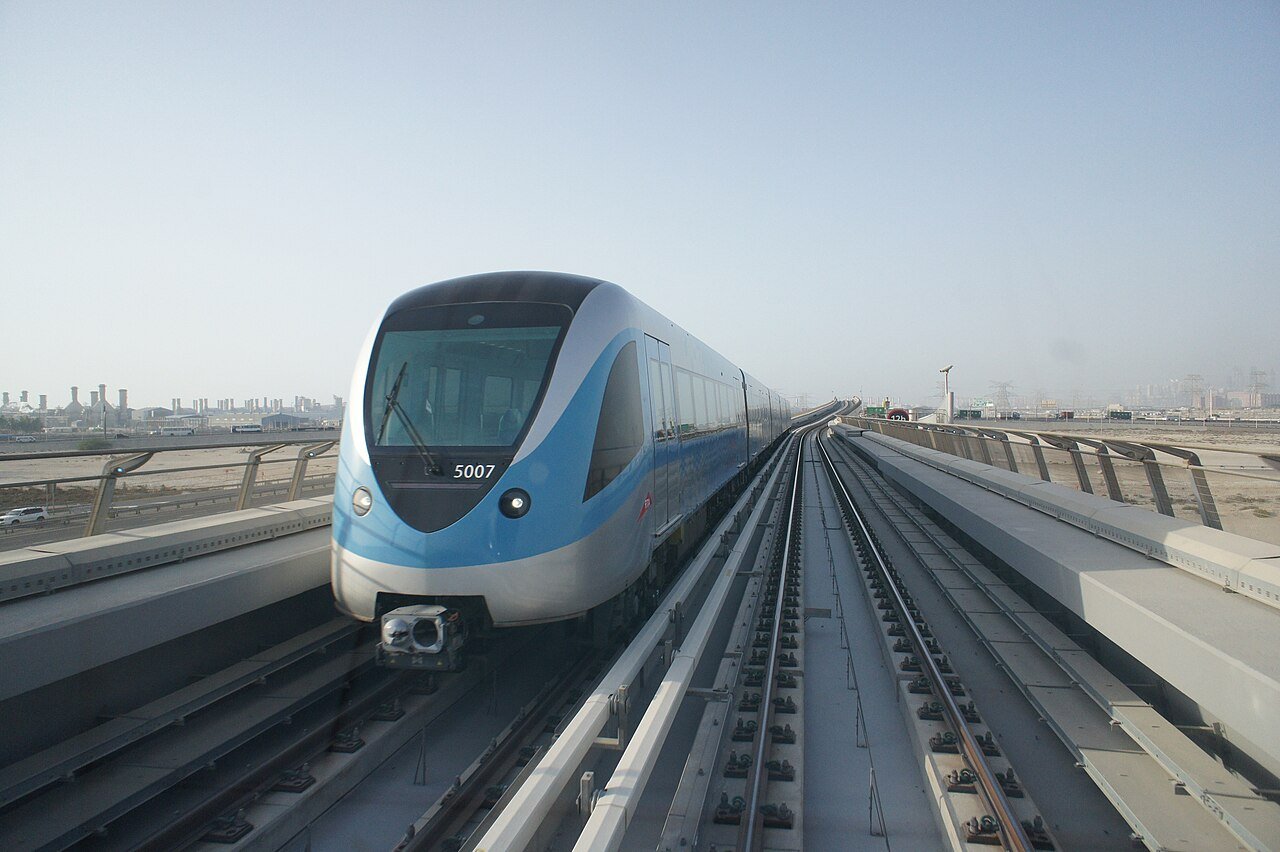
Photo: Dubai Metro 2011, Banku, CC BY-SA 3.0. Resized. Charts and maps by Tim and Lily.